
| BillSki's Triple-Black Diamond Toolbox | |||
| HOME | RESORT REPORTS | DEALZ & LINKZ | Boston | |
| SSC | SSC/BL DAYS 2019 | Analysis | hiking | |
(Current conds)
(map of cams & current conditions) |
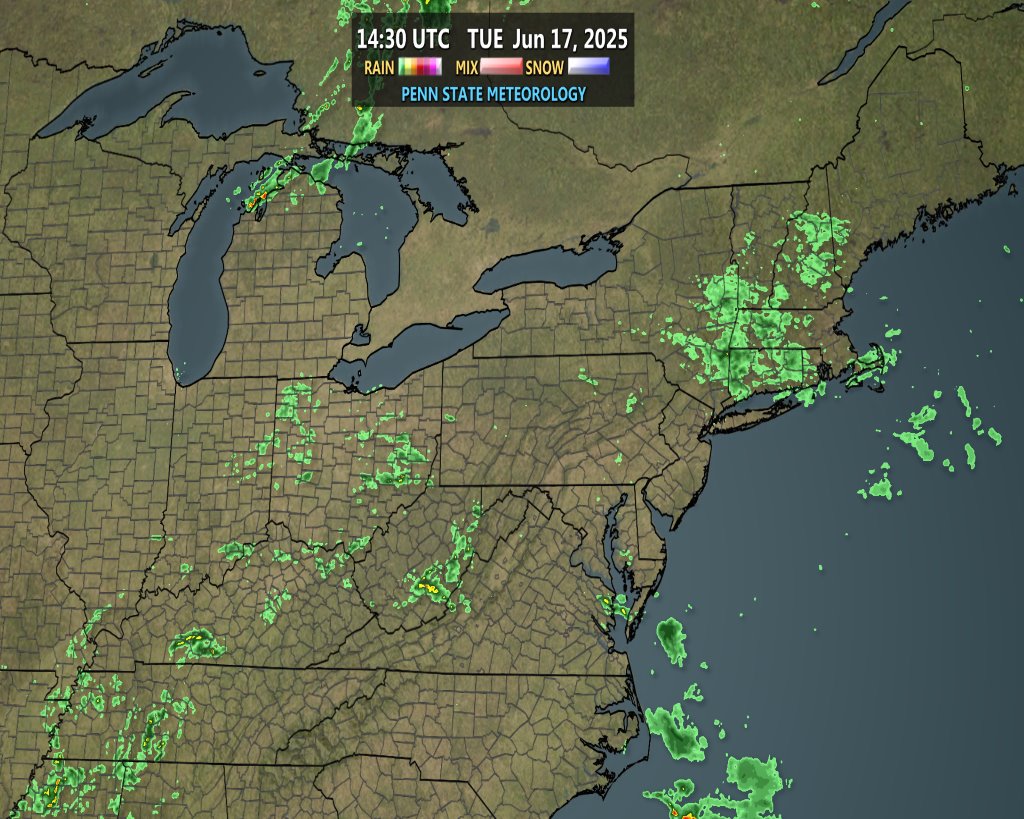
NWS RADAR
NWS Graphical Fcst
PSC
|  WX.US
Pivotal
TT |
| Forecasts | Models | Current | CHATTER | WFO |
NWS WPC Nat'l Fcst Map
wxrisk Update
| NAM-GFS Anim NAM/NCP/GFS SnowfallNCEP MODELS CANADA CAN Modeling | WunderMap
Vermont NH
National |
| VT
FB
ME
NH
MA
CA
|
|
 |  |  | |
 |  | ||
 |  |  |
 SKI AREA CAM SKI AREA CAM |  |
 HIGHWAY CAM HIGHWAY CAM |  |
| NWS
| NoBull (Paid) |
|
MISCELLANEOUS
LiftSift Liftopia Knigge's Maps
Skiing on the Cheap
2007-08 2008-09 2009-10 2010-11 2011-12 2012-13 2013-14 2014-15 2015-16
Last Update: September 20, 2021
Copyright 2006-2021, Bill Tarkulich Non-commercial use is OK.


